HANDS-ON PROJECTS
Welcome to my project portfolio, a diverse collection of projects that showcase my proficiency in Business Data Analytics and Data Engineering. What sets these projects apart is the wide array of tools and technologies I’ve used, including Power BI, Microsoft Excel, SQL, and Python.
Each project showcases my analytical thinking, problem-solving abilities, and attention to detail, ensuring accurate and reliable results.
From optimizing operational workflows and enhancing regulatory compliance to identifying key trends and facilitating data-driven decision-making, these projects demonstrate my commitment to driving tangible business impact through data-driven strategies.
Picture this scenario in an Enterprise setting, An external data source, such as third-party APIs or vendors’ data, needs to be integrated into your company’s database. To achieve this, ETL (Extract, Transform, Load) processes come into play. ETL processes serve the purpose of extracting data from external sources, transforming it to meet your specific requirements, and then loading it into your database.
ETL processes are applied to clean and improve data quality before it’s inserted into the production database and also ensure that external data doesn’t impact the performance or integrity of the production database. This helps maintain data integrity and accuracy.

This project centers on the comprehensive analysis of penguin data using Python, with a specific focus on understanding the relationships between different size-related attributes of penguins.
By examining attributes like culmen length, culmen depth, flipper length, and body mass, the analysis aims to uncover correlations and patterns in the data.
Through statistical methods and visualizations, this study will provide insights into how these size-related characteristics are interconnected among various penguin species.

The 2022 FIFA World Cup took place over the course of one month and featured 32 teams from around the world. The tournament has been held every four years since the first one in 1930, with the exception of 1942 and 1946 when it was postponed because of World War II.
Qatar automatically qualified to the group stage of the competition; however, Argentina won the competition, making it their third championship overall. They were world champions in 1978 and 1986 as well.

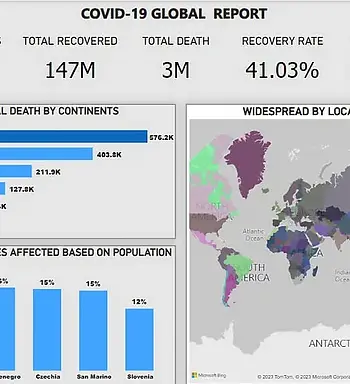
This project aims to leverage my SQL capabilities to gain valuable insights from the COVID-19 dataset, helping us better understand the impact of the pandemic on various aspects of public health.
Tools Used: Microsoft SQL Server, Microsoft PowerBI
Skills used: JOINs, Temp tables, Aggregate function, Converting data types.
I took part in a three-month intensive. training program run by UMA Tech Unilag, and this assignment was given to us. We were instructed to obtain a dataset (CSV file) from Kaggle.
The tool used for this project is Microsoft Excel

I made this dashboard using the INDEX & MATCH function; Both VBA and pivot table were not used. It is a simple Financial Dashboard for Professional Finance.
This project aims to provide an interactive dashboard highlighting the year’s key performance indicators (KPIs) in 2020.
